Family, Food, and Football
The NFL fan in
me loves the fact that our Thanksgiving celebrations can include what I
consider to be the best of all professional sports. The math teacher in me is thankful for the
fact that sports give us so many opportunities to observe math being modeled in
real life.
Since we’re
on the topic of being thankful, I think it would be interesting to analyze
something that most professional athletes can be very thankful for… salaries.
In 1967, the
average NFL salary was about $25,000 and most players made less money than the
average working American. In contrast, last
year (2011) the average NFL salary was about $1,900,000 and every player made
quite a bit more money than the average American.
So, exactly how
have NFL salaries grown over the last 45 years?
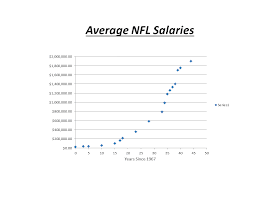
Plotting average NFL salaries can help us analyze the trends:

It appears
that NFL salary growth was fairly slow at first. However, through the years, the growth rate
has increased dramatically.
So, what
type of mathematical model best fits this data?
Let’s begin by looking at a linear model. Using the first and last years in this study,
and letting the year 1967 correspond with x
= 0, we get the equation:
y = 42,613.64x + 25,000
This equation
indicates that salaries started at $25,000 in 1967, and then increased steadily
at a rate of $42,613.64 per year after that.
Here is a graph of the linear model:

In analyzing
the graph, it is clear that this model doesn’t fit the data points very well. Let’s see how an exponential model fits the points. Using a regression program to approximate an equation
matching this data (again letting the year 1967 correspond with x = 0) I came up with:
y = 38,128.42e0.09461x
This
equation is a little more difficult to interpret. It indicates that salaries started at
$38,128.42 in 1967 and then grew continuously at a rate of 9.461% per year. We may be tempted to think that this model is
not very accurate, since it indicates a starting salary that is much different
than what we know to be the case.
However, when we analyze the graph we see that this model fits the data
quite well.

So, what
does it all mean?
Nobody can
predict the future with absolute certainty.
However, if we are going to make predictions about the salaries of NFL
players in the future, it would be best to use the model that most closely fits
the data that we have – the exponential model.
(By the way, according to this model, the average NFL player will make
$9,212,715.57 in the year 2025.)
Happy
Thanksgiving!
-----------------------------------------------
For Online Tutorials and Silly Math Songs, visit www.onlinemathpro.com

No comments:
Post a Comment